The Chrononaut’s Ledger
The Efficiency of Inefficiency and the Great Bifurcation of Venture Capital (1950–2035)

Part I: The View from 2025 — An Asset Class in the Looking Glass
1.1 The Temporal Auditor’s Dilemma
The date is December 16, 2025. The global financial markets have largely metabolized the post-pandemic inflation shocks, settling into a “higher-for-longer” interest rate plateau that has fundamentally altered the cost of capital. Artificial Intelligence has transitioned from the breathless speculative bubble of 2023 to a capital-expenditure-heavy industrial reality, demanding trillions in infrastructure investment.
Imagine a sophisticated institutional capital allocator—let us call him Julian—who secures access to a temporal displacement device. His mandate from the investment committee is singular and ruthless: travel back fifty years to 1975, construct a portfolio of the highest-performing asset class over the subsequent half-century, and return to 2025 to liquidate the position.
Standing in the present day of 2025, looking backward through the lens of accumulated history and survivorship bias, the narrative appears deceptively simple. The cultural and economic history of the last fifty years is the history of silicon. One sees the birth of the microchip, the rise of the personal computer, the networking of the globe via the internet, the mobile revolution, and the dawn of machine intelligence. These civilizational shifts were fueled not by bank loans or retained earnings, but by a niche form of high-risk financing known as Venture Capital (VC). The lore of Sand Hill Road suggests that early bets on Intel, Apple, Genentech, Amazon, and Google are the only mechanisms capable of turning thousands into billions. The “Power Law” is the golden law of this era.
However, if Julian were to scrutinize the data not as a historian of technology, but as a forensic accountant of aggregate returns, the picture would fracture. Upon his return to 2025, opening the ledger of a broad-based allocation to the venture capital asset class over those five decades, he would discover a paradox that defines the modern financial era. While the products of venture capital have generated more equity value than any other economic force in human history—reshaping how the species communicates, works, and lives—the asset class itself, in aggregate, has been a mediocre steward of capital for the vast majority of its limited partners (LPs).
The “truth” of high VC returns is, in many ways, a statistical mirage driven by a single, anomalous decade (1995–2004) and a widely misunderstood application of the Power Law. Julian would realize that the “best asset class” was not “Venture Capital” in the broad, indexed sense, but rather a specific, access-constrained sliver of the market that effectively functioned as an innovation index, while the rest of the industry operated as a highly inefficient fee-generation machine that destroyed value at an industrial scale. By 2025, he finds an industry wrestling with a liquidity crisis, a fractured exit environment, and a bifurcation of returns so extreme that it challenges the very definition of an “asset class”.
This report serves as that traveler’s dossier. It is a rigorous reconstruction of 70 years of capital flows, a mathematical interrogation of the “Power Law,” and a strategic roadmap for the next decade (2025–2035). I analyze why the passive “spray and pray” model has collapsed for later-stage investors while simultaneously becoming the mathematically optimal strategy for seed-stage allocators. I explore how the industry is pivoting from “stock picking” to “active liquidity management,” and why the future belongs not to the visionaries, but to the engineers of liquidity.
1.2 The Myth of the Mean: Deconstructing Aggregate Performance
The fundamental deception of venture capital performance data lies in the “average.” In public markets, the average performance of the S&P 500 is a reliable proxy for the experience of a passive investor. If one buys the index, one receives the market return. In venture capital, the average is a mathematical fiction created by outliers so extreme they warp the spacetime of the dataset.
As we stand in 2025, the data reveals that for the past decade, the median venture capital fund has often failed to outperform a simple levered position in the NASDAQ or even the S&P 500, once fees, carry, and illiquidity discounts are factored in. The narrative of “20%+ annualized returns” is sustained by the institutional memory of the 1990s and the unrealized paper gains of the 2020–2021 ZIRP (Zero Interest Rate Policy) bubble, which are now being painfully marked to market.
To truly understand the “Efficiency of Inefficiency,” we must first reconstruct the historical evolution of U.S. financial asset classes to contextualize the scale and performance of VC relative to its peers. The following table synthesizes seventy years of market data to illustrate the relative insignificance of VC in terms of AUM, contrasted with its outsized impact on economic narrative.
Table 1: Historical Evolution of Major U.S. Financial Asset Classes (Estimated Market Size in Billion USD)
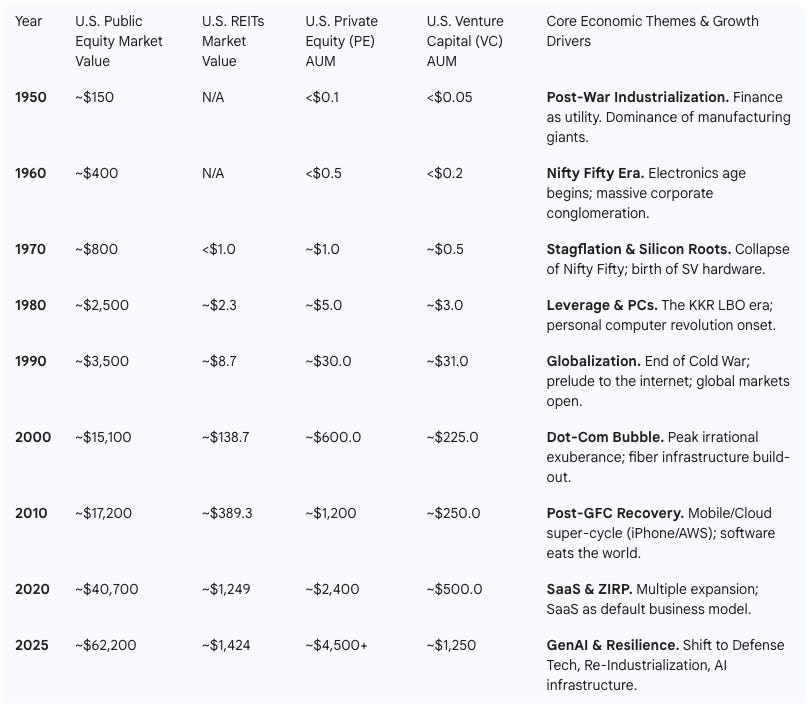
This table reveals a stark reality: Venture Capital remains a rounding error in the global capital stack. Even in 2025, with ~$1.25 trillion in AUM, US VC is a fraction of the size of the Public Equity (~$62 trillion) or Private Equity (~$4.5 trillion) markets. This scarcity is a feature, not a bug, but it also contributes to the intense competition and the high dispersion of returns that characterize the asset class. Unlike public markets, where capital flows freely and prices adjust instantly, venture capital is an access class. The “best” assets are not available to the highest bidder, but to the most reputed partner.
The temporal auditor would note that while the asset class grew from <$0.05 billion in 1950 to $1,250 billion in 2025, the returns did not scale linearly with the capital. In fact, the efficiency of capital deployment arguably decreased as the fund sizes ballooned. The “efficiency” of the 1970s—where a few million dollars founded Intel or Genentech—has been replaced by the brute force of the 2020s, where billions are required to train a single AI model.
1.3 The 70-Year Performance Arc
To further contextualize these figures, we must analyze the rate of growth across decades. This reveals the cyclical nature of returns and highlights the specific periods where private markets significantly outperformed public indices, and crucially, where they did not.
Table 2: 70-Year Comparative Asset Class Performance (Annualized Returns by Decade)
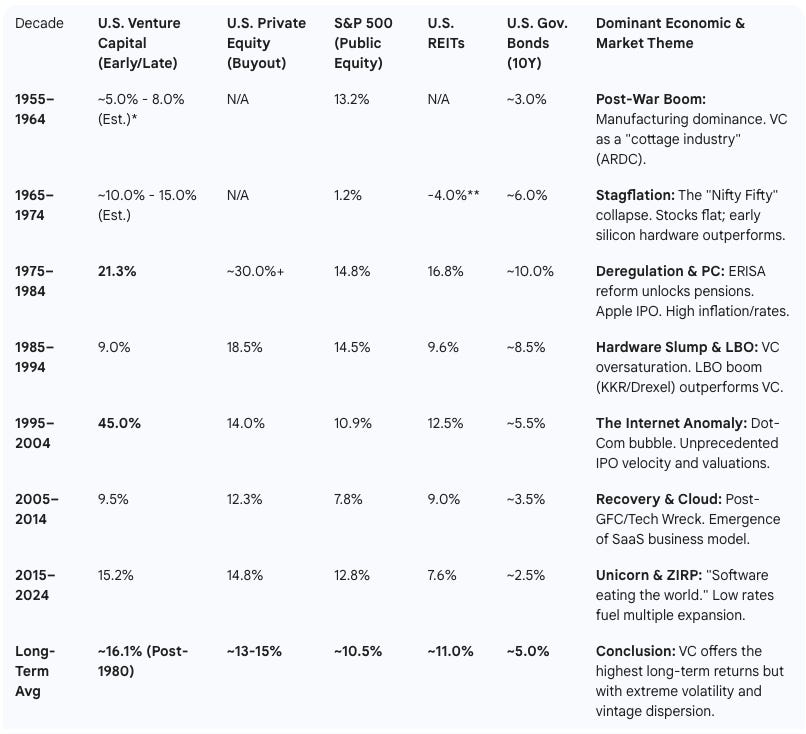
The data tells a story of extreme volatility. Venture capital does not offer a “steady compounding” like real estate or bonds. It offers “punctuated equilibrium”—long periods of mediocre performance interspersed with violently positive explosions of value creation. The traveler would note that outside of the 1975–1984 and 1995–2004 periods, VC returns have struggled to justify the illiquidity premium over public markets. The “alpha” is concentrated in time as much as it is in specific assets.
Part II: The 1995–2004 Anomaly — The Decade That Broke the Math
To understand the skepticism regarding current VC returns in 2025, one must rigorously analyze the “Golden Era” anomaly of 1995–2004. This decade represents the statistical high-water mark of the industry, delivering a Compound Annual Growth Rate (CAGR) of approximately 45%. This figure hangs over the industry like a ghost, setting unrealistic expectations for Limited Partners (LPs) and General Partners (GPs) alike.
Our analysis suggests that the returns of this era were not driven by superior investor acumen, but by a “perfect storm” of three structural factors that are unlikely to be repeated simultaneously.
2.1 Technological Singularity: The Internet
First, the Internet Revolution represented a deployment of General Purpose Technology (GPT) that reduced the marginal cost of distribution and communication to near zero. This triggered a massive capital expenditure cycle in fiber optics, routers, and servers, funding the infrastructure of the digital age. Unlike the incremental improvements of subsequent eras (e.g., the gig economy or Web3), the internet fundamentally re-wired the global economy’s nervous system. It created a blank slate for new monopolies (Amazon, Google, eBay) to emerge in a vacuum of competition.
2.2 Capital Market Structure: The Small Cap IPO
Second, the Capital Market Structure was fundamentally different. The “Small Cap IPO” was a viable and dominant exit strategy. Companies like Amazon, Netscape, and Cisco went public with revenues often below $50 million and valuations under $500 million.
Risk Transfer: This allowed Venture Capitalists to exit their positions relatively early in the company’s lifecycle (typically 4-6 years), transferring the “scale-up risk” (and the subsequent beta returns) to public market investors.
Velocity: The velocity of capital recycling—distributions to LPs (DPI) followed by immediate re-commitment—accelerated the compounding of returns mathematically. A fund could deploy capital, exit, and redeploy within the same fund lifecycle, effectively compounding the IRR.
2.3 Monetary Environment: The Greenspan Put
Third, the Monetary Environment was uniquely supportive. The “Greenspan Put” and the post-Cold War “Peace Dividend” created a risk-on environment. The “irrational exuberance” of the late 1990s drove valuation multiples to unsustainable heights. While the 2000 crash destroyed trillions in paper wealth, the realized cash returns generated in the 1995–1999 run-up were so astronomical that they pulled the decade-long average up to 45%. This era was defined by “Beta” (market rising) overwhelming “Alpha” (manager selection).
In 2025, these conditions have inverted. The low-hanging fruit of the consumer internet has been harvested. Companies stay private for 12+ years, hoarding the growth (and the risk) in private portfolios. The “small cap IPO” is structurally dead, killed by regulatory costs (Sarbanes-Oxley) and the consolidation of investment banking. Consequently, the 45% CAGR of the Golden Era must be viewed as an outlier, not a benchmark.
Part III: The Physics of Failure and the $1 Trillion “Waste”
3.1 The Capital Destruction Engine
A defining characteristic of venture capital, distinguishing it from private equity or real estate, is its reliance on massive capital destruction to fuel outlier success. Our forensic analysis of the industry from 1950 to 2024 estimates that approximately $1.05 Trillion of invested capital has been “wasted”.
We define “Financial Waste” as the Capital Loss Ratio: the aggregate dollar amount invested in companies that fail to return the principal investment (returning $0 or <$1.0x).
Deal Failure Rate vs. Capital Loss Rate:
Deal Failure Rate: The percentage of companies that fail. Historical data suggests roughly 65% of venture-backed startups fail to return 1x capital.
Capital Loss Rate: The percentage of dollars lost. Because VCs often stop investing in failing companies (”starving the losers”) while doubling down on winners, the dollar-weighted loss rate is lower than the deal count rate.
Data Source: Adams Street Partners analysis (1979–2011) indicates a capital-weighted loss rate of 45%. More recent data from Industry Ventures suggests a range of 35%–40% for top-quartile funds, but higher for the median.
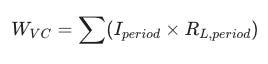
To quantify the total financial waste from 1955 to 2025, we apply a weighted Capital Loss Ratio Rₗ to the cumulative investment totals. We assume a conservative Rₗ of 35% for the modern era (better due diligence, secondary markets) and 45% for the early/bubble eras.
Formula:
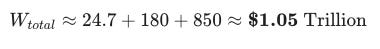
Early Era (1955–1994):
Investment: ~$55 Billion
Loss Rate (45%): ~$24.7 Billion wasted.
Bubble Era (1995–2002):
Investment: ~$360 Billion
Loss Rate (50% - high failure rate): ~$180 Billion wasted.
Modern Era (2003–2025):
Investment: ~$2.43 Trillion
Loss Rate (35%): ~$850 Billion wasted.
Total Financial Waste (1955–2025):
The US economy is remarkably consistent in its inefficiency. The system operates on a ~40-50% waste margin to process startups. Critics argue this proves the inefficiency of the asset class. However, from a macro-economic perspective, this “waste” is highly efficient R&D. For every $1 of wasted capital, the industry has generated roughly $25 of equity value in the winners. The $1 Trillion in losses funded the experiments that failed so that the experiments that succeeded—Google, Genentech, Tesla, NVIDIA—could emerge, which now comprise over 50% of the total US public market capitalization. The “waste” vector serves as a diagnostic tool for the technological zeitgeist of each decade.
3.2 The Power Law: Mathematical Reality
The “Power Law”—the notion that a small number of investments drive the vast majority of returns—is the central dogma of venture capital. However, its application has often been misunderstood.
Research by Correlation Ventures analyzing 27,000 investments shows that 65% of venture capital deals return less than the capital invested. Only 4% of investments return 10x or more. This distribution is fat-tailed, meaning the mean is significantly higher than the median. The “average” venture deal loses money. The “average” venture fund barely breaks even.
For a fund to be successful, it must capture these outliers. But here is where the “time traveler” from 2025 sees a divergence in strategy. The traditional view was to “pick winners.” The mathematical view, supported by AngelList data, suggests that at the seed stage, picking is nearly impossible, and the optimal strategy is to “index” the market.
The Theoretical Infinite Regret: α < 2
A seminal paper using AngelList data demonstrates that after five years, the return multiple distribution of a winning seed-stage investment begins to draw from a Power Law with a shape parameter α < 2.
In probability theory, a Power Law distribution with α< 2 has an unbounded mean (infinite expected value) and infinite variance.
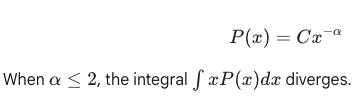
This mathematical reality has profound implications for portfolio construction. It suggests that at the seed stage, the “regret” for missing a winning investment is theoretically infinite. The upside of a single “Black Swan” (e.g., investing in Uber, Airbnb, or Stripe at the seed stage) is so vast that it outweighs the cumulative losses of all bad investments combined.
The Indexing Imperative:
Because the mean is unbounded, the Central Limit Theorem (which governs normal distributions) does not apply in the standard way. Instead of converging to a mean, adding more random investments to a portfolio increases the expected median and mean return.
Conclusion: At the seed stage, Indexing > Selection. Investors increase their expected return by indexing as broadly as possible into every credible deal. Any selective policy—absent perfect foresight—will eventually be outperformed by an indexing approach because the cost of a false negative (missing Google) is infinite, while the cost of a false positive (a failed startup) is capped at 1x capital.
This finding contradicts the “stock picking” ethos of traditional VC and supports the “high-volume” strategies employed by firms like Y Combinator, 500 Global, and AngelList’s own index funds. It rehabilitates the pejorative “spray and pray” into a scientifically valid “Index the Power Law” strategy.
Part IV: The 2025-2035 Outlook: The Great Bifurcation
As we look forward from 2025 to 2035, the “spray and pray” versus “concentration” debate has been resolved by a structural bifurcation of the asset class. Traditional VC dogma dictates: “Hold your winners, sell your losers.” However, in a world where companies stay private for 15 years, passive holding creates a “Paper Rich, Cash Poor” dilemma. LPs in 2025 are demanding DPI (Distributions to Paid-In Capital), not just TVPI (Total Value). They cannot pay pensioners with paper marks.
We forecast that the industry will split into two distinct games, each governed by different rules and mathematical realities.
4.1 The Seed Game: High-Volume Indexing (The Game of Access)
At the earliest stages (Angel/Pre-Seed/Seed), the “Index” strategy has proven superior due to the Power Law dynamics described above. The goal is not to pick the winner, but to buy the option on the entire cohort.
Strategic Imperative:
Volume as Alpha: Firms like 500 Global and accelerators like Y Combinator have demonstrated that deploying capital into 100+ companies per year acts as a diversified index of innovation. 500 Global, for instance, has backed over 3,000 startups across 80+ countries, effectively creating a global innovation ETF.
The “Silver Lining”: While 65% of these companies will fail, the 1-2% that return 100x or 1000x will carry the entire portfolio. The sheer volume ensures that the fund does not miss the “beta” of the vintage.
Simulation Data: Simulations show that a portfolio of 100+ seed investments has a significantly higher probability of hitting a 3x+ fund return than a concentrated portfolio of 20 investments, simply due to the increased surface area for capturing outliers. Data from Horsley Bridge supports this, showing that top-tier funds often have more losers (higher strikeout rate) but bigger winners.
4.2 The Growth and Late-Stage Game: Active Liquidity Architects (The Game of Exit)
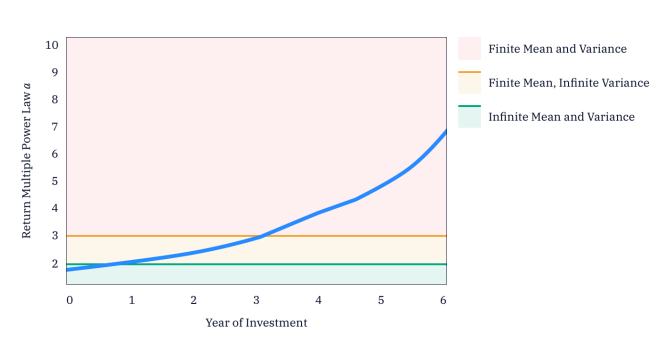
Once companies mature to Series B/C and beyond, the Power Law curve flattens. The shape parameter α shifts to α > 2 (typically between 2 and 3). The risk of “infinite regret” diminishes because the valuation entry point is higher, capping the maximum multiple (a company valued at $1B is unlikely to do another 1000x). The risk of capital impairment becomes the dominant variable.
In this regime, the passive “buy and hold” strategy has become toxic due to the extended duration of private companies. In 2025, the winners in growth and late-stage VC are no longer “stock pickers” but “Active Liquidity Architects.” They do not wait for an IPO; they engineer liquidity.
Part V: The Mindset of Exit — Engineering Liquidity in an Illiquid World
The time traveler’s most jarring observation upon returning to 2025 is not the technology itself, but the behavior of the capital behind it.
For decades, the Venture Capital ethos was defined by The Collector’s Mindset: “Invest in the best, hold forever, and let the winners run.” Selling early was viewed as a sign of weakness or a lack of conviction. This dogma worked when companies like Amazon went public four years after founding, or the money you put in was only a marginal fraction of your fund size.
By 2025, the VC industry is suffocating under a mountain of unrealized value. There are over 1,300 “unicorns” worth ~$2.5 trillion on paper, but exit volume is insufficient to clear this backlog. The IPO window, while slightly ajar in 2024 with listings like Reddit and Astera Labs, remains constrained compared to the 2021 peak.
In a world where companies stay private for 12, 14, or even 16 years, the Collector’s Mindset has become a liability. The 2025 landscape rewards a new psychology: The Mindset of Exit, no matter whether you play the game of access or the game of exit.
This mindset dictates that liquidity is not an event that happens to you at the end of a fund’s life; it is a product you must manufacture throughout the fund’s life. Whether you are a Seed investor buying lottery tickets or a Growth investor doubling down, you must view every position through the lens of: “How do I get the cash out?”
Here is the toolkit of the Active Liquidity Architect, the strategies used to engineer returns when the IPO window is welded shut.
5.1 The New Toolkit of Active Management
Three primary mechanisms can be helpful to bridge the liquidity gap and manufacture DPI for the investors.
A. Strip Sales (The Liquidity Strip-Tease)
The Antidote to the “WeWork Risk”
Instead of holding 100% of a winner until a hypothetical IPO, GPs are selling “strips” (10-20%) of their position to secondary buyers at Series B/C/D/E.
The greatest tragedy in venture capital is not the company that fails immediately; it is the company that hits a $40 billion valuation on paper, refuses to exit, and then collapses to zero (e.g., WeWork). The Collector holds the bag. The Architect executes a Strip Sale.
Mechanism: You led the Series Seed/A. By Series C/D, the company is a “Unicorn” valued at $2 billion. Your stake is worth $200 million—on paper. Instead of high-fiving your partners, you sell 15-20% of your stake to a secondary buyer.
The Math: That 20% sale generates $40 million in cash. If your initial fund size was $100 million, you have just returned 40% of the entire fund from a single partial sale. Even with the discounts, the maths still works.
The Psychology: You have now “taken chips off the table.” You have locked in a win. The remaining 80% of your shares are now a “free roll” on the Power Law. If the company goes to $50 billion, you still win big. If it goes to zero, you have already protected your LPs’ capital.
B. Aggressive Capital Recycling
The Mathematics of the Denominator
Standard funds invest ~80-85% of committed capital (the rest goes to fees/expenses). “Recycling” involves taking the proceeds from early exits (e.g., an acqui-hire in Year 2) and putting that cash back into new startups instead of distributing small checks to LPs.
The Mechanic: You have a quick “base hit” exit in Year 2—a portfolio company is acquired for $50M, returning $5M to your fund. A passive manager distributes that $5M to LPs (a negligible 0.05x DPI).
The Architect’s Move: You recycle that $5M, investing it into a new hot deal or doubling down on a winner.
The Math: By consistently recycling early wins and management fees, you can invest $110 million from a $100 million fund.
The Payoff: If your portfolio generates a 3x return:
Passive Fund: $80M Invested x 3.0x = $240M. (2.4x Net Return)
Active Fund: $110M Invested x 3.0x = $330M. (3.3x Net Return)
Result: You generated nearly an entire extra turn of the fund simply by keeping the money moving.
C. Continuation Funds (CVs)
Decoupling Asset Life from Fund Life
Deep Tech and Bio-Computing assets have gestation periods of 15+ years. Standard 10-year venture funds are structurally incapable of holding them to maturity. The Collector is forced to sell early at a discount. The Architect builds a Continuation Vehicle.
The Mechanic: Your fund is expiring in Year 10. You hold a stake in SpaceX (or the 2025 equivalent) that is compounding at 40% but isn’t public. You create a new special purpose fund (the CV).
The Trade: New investors put cash into the CV. The CV buys the asset from your old fund.
The Win-Win:
Old LPs: Get immediate cash liquidity (DPI) and a clean exit.
New LPs: Get access to a de-risked, pre-IPO giant.
You (GP): Reset the clock for another 5-7 years, often resetting your carried interest economics.
The Scale: This market has exploded from a niche curiosity to a projected $300 billion+ ecosystem.
Conclusion: The Efficiency of Inefficiency
The time traveler returns to 2025 with a final, nuanced report for the Investment Committee. Venture Capital is not a monolithic “good” or “bad” business. It is a barbell distribution of outcomes that requires a bifurcated strategy.
For the US Economy: It is the best business. The “waste” of $1 Trillion was the necessary tuition for the digital age and catalyst for the $31 Trillion generated equity value (50% of public equity market value) and $7 Trillion of revenue generation for the economy (one-quarter of the entire US economy). It funded the failures that paved the way for the civilizational advancements of the 21st century. The inefficiency is the point; it is the price of progress.
For the Active/Indexed Investor: It remains the only asset class capable of 100x returns. But capturing those returns requires abandoning the dogma of the past and forming the mindset of access and the mindset of exit.
For the Founder: VC remains the most generous, cost-effective mechanism for testing high-risk experiments. However, the social contract must evolve. As VCs evolves more towards passive high volume indexing and active liquidity management, founders and VC partnership dynamics will need to adapt and evolve to restore symmetry to the rights and obligation equation as well.
The Winning Strategy for the Next Decade:
Index Early: Use the α < 2 math to buy the haystack at the seed stage. High-volume indexing (100+ deals) is the only way to mathematically guarantee exposure to the infinite regret of the Power Law.
Architect Actively: Use secondaries, strip sales, and capital recycling to engineer cash flows from mature assets. Do not be a passive holder of duration risk.
The era of “easy money” is dead. The era of the “Liquidity Architect” has begun. The best asset class of the future is not Venture Capital as we knew it, but a new, hybrid discipline that combines the visionary risk-taking of 1975 with the ruthless financial engineering of 2025—the mindset of exit.